Page MenuHomePhabricator

Pages loading without formatting too often
Closed, DeclinedPublic

Description

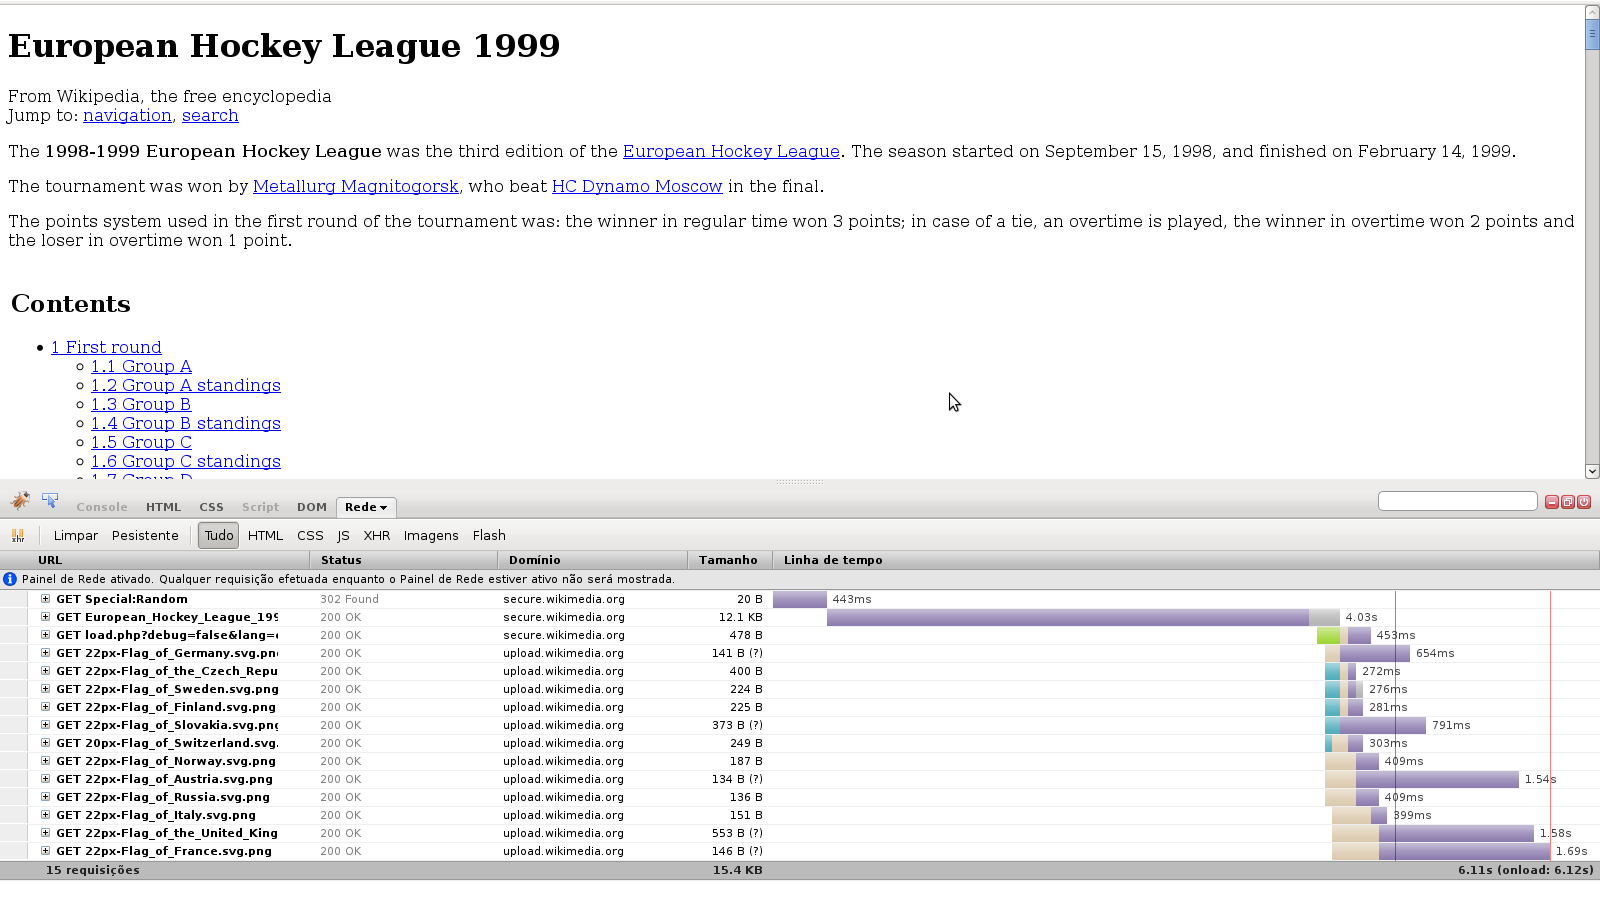
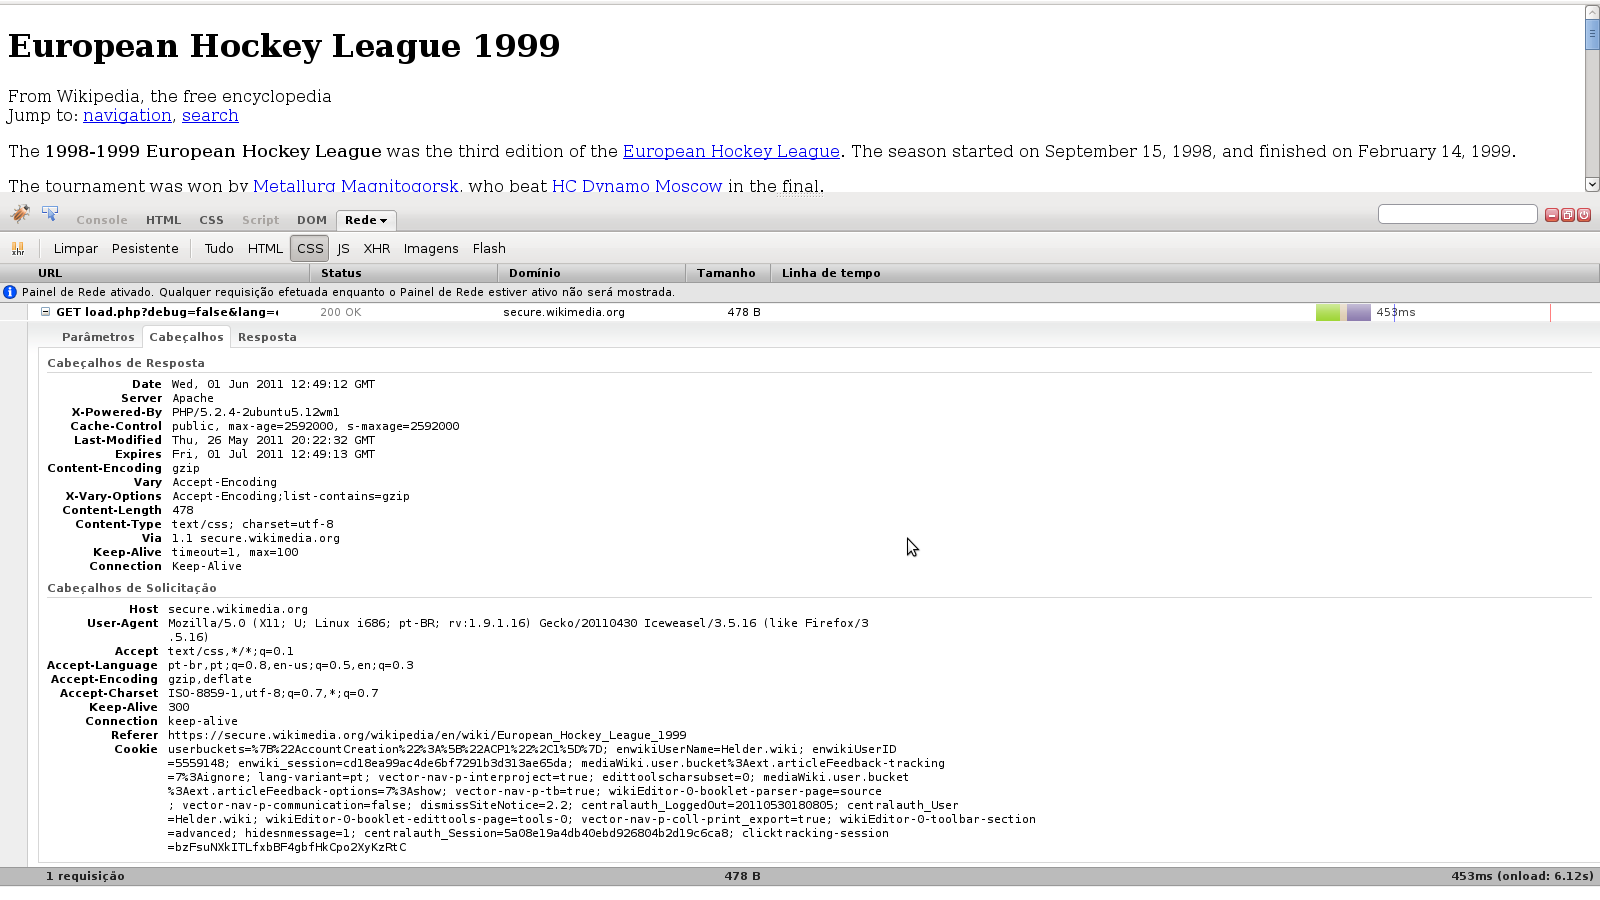
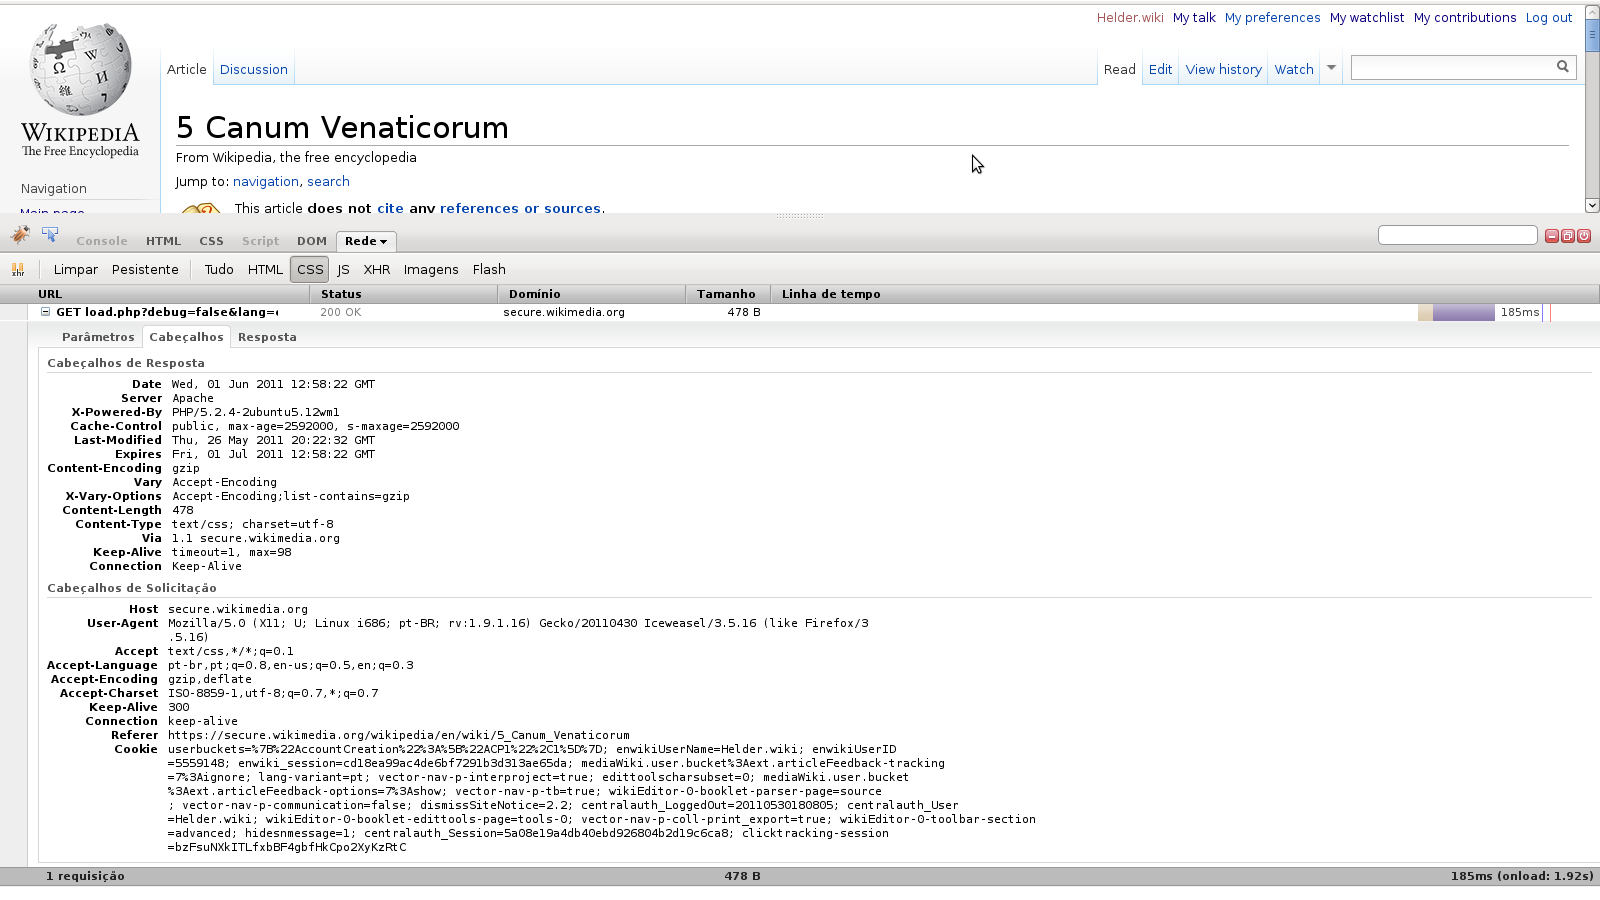
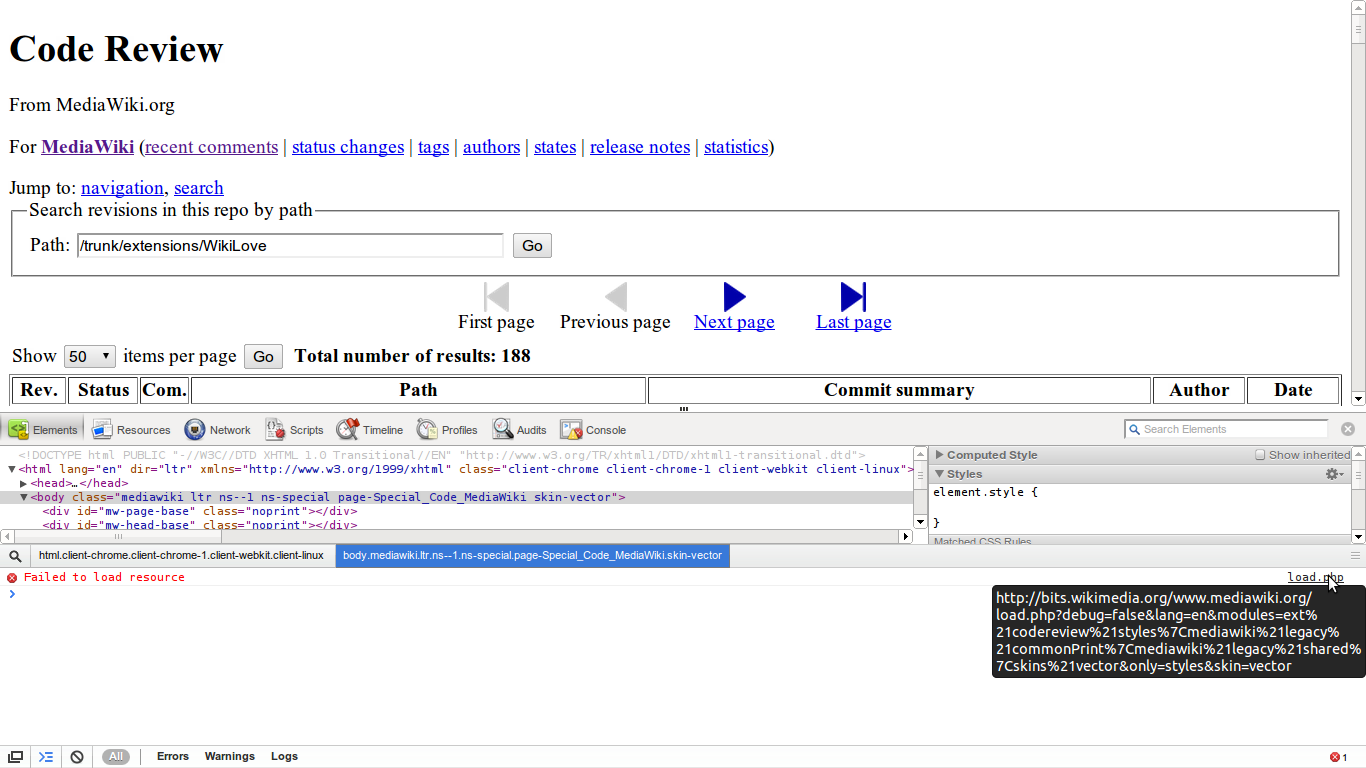
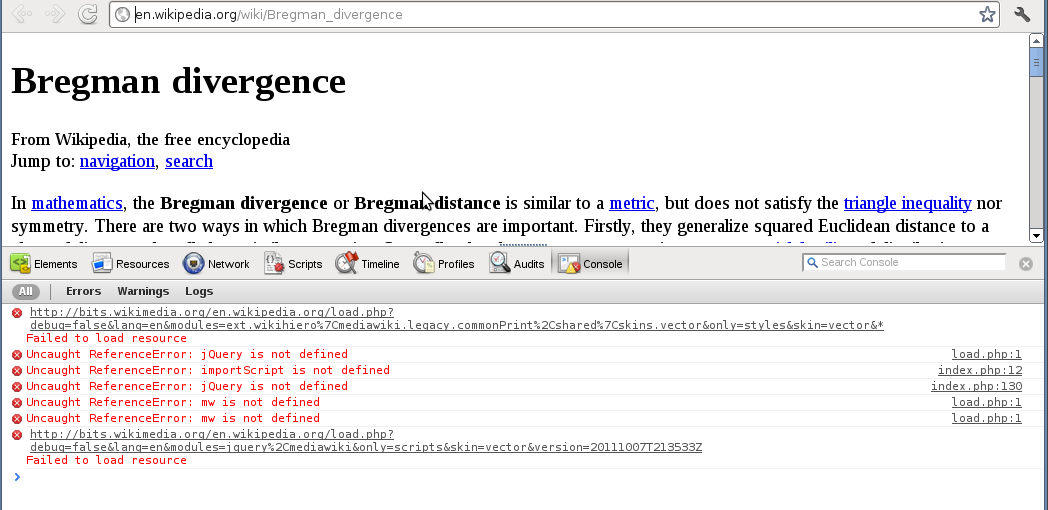
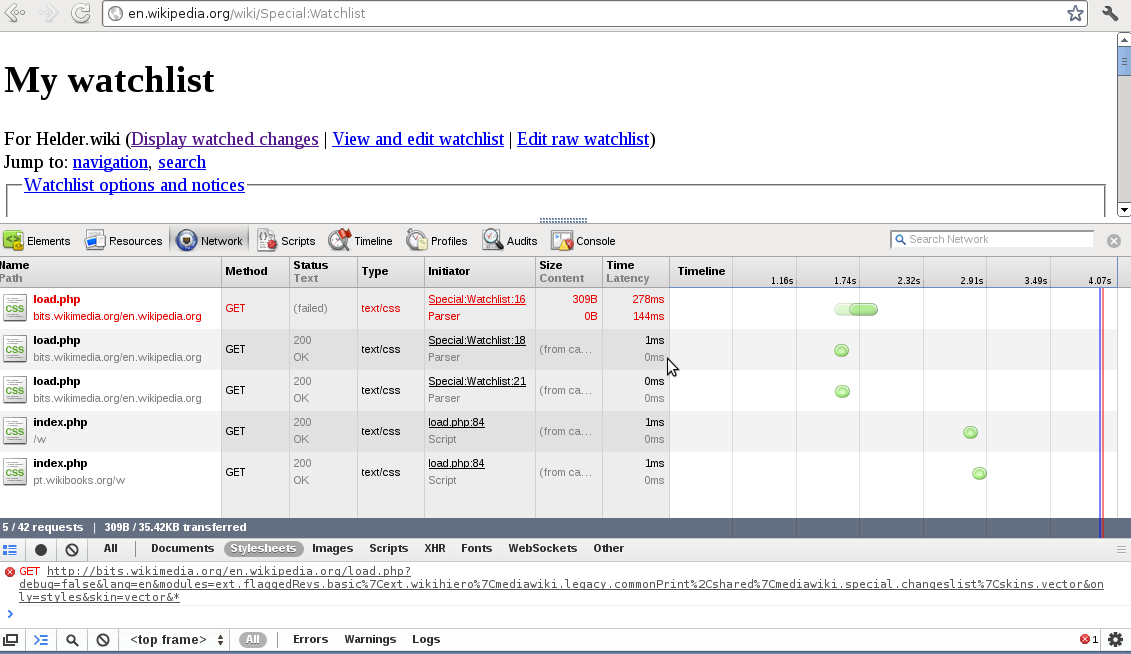
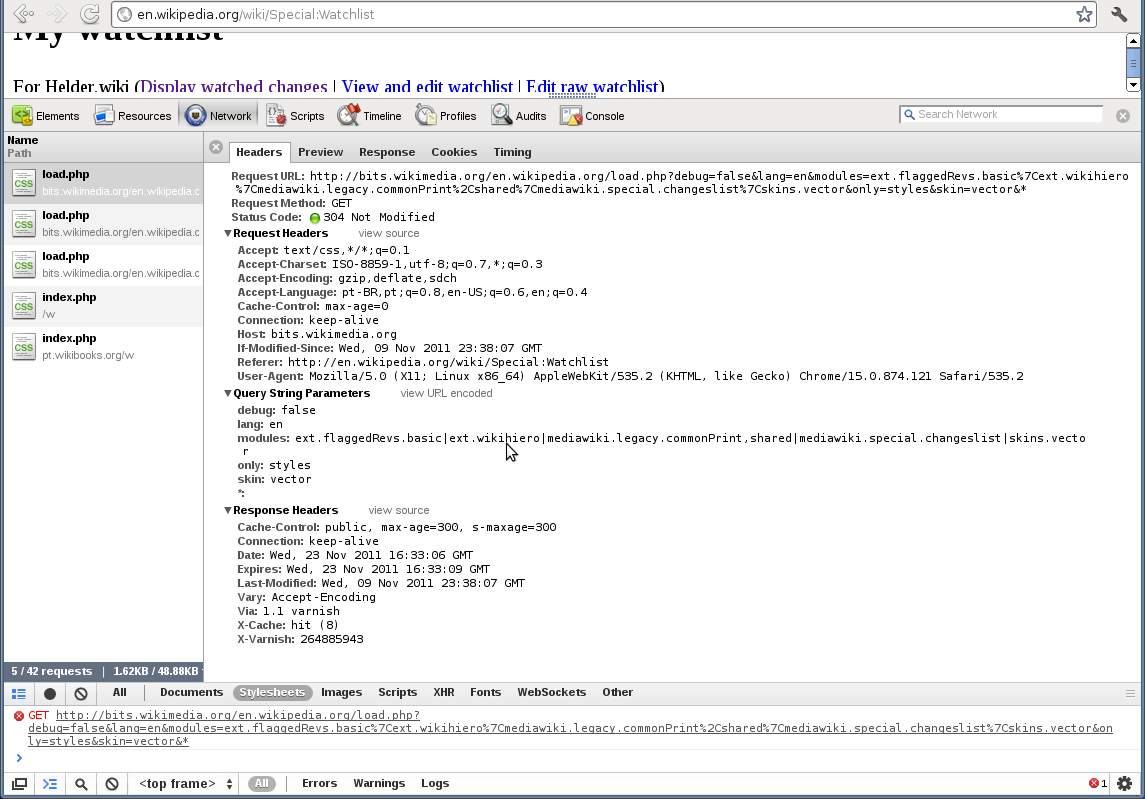
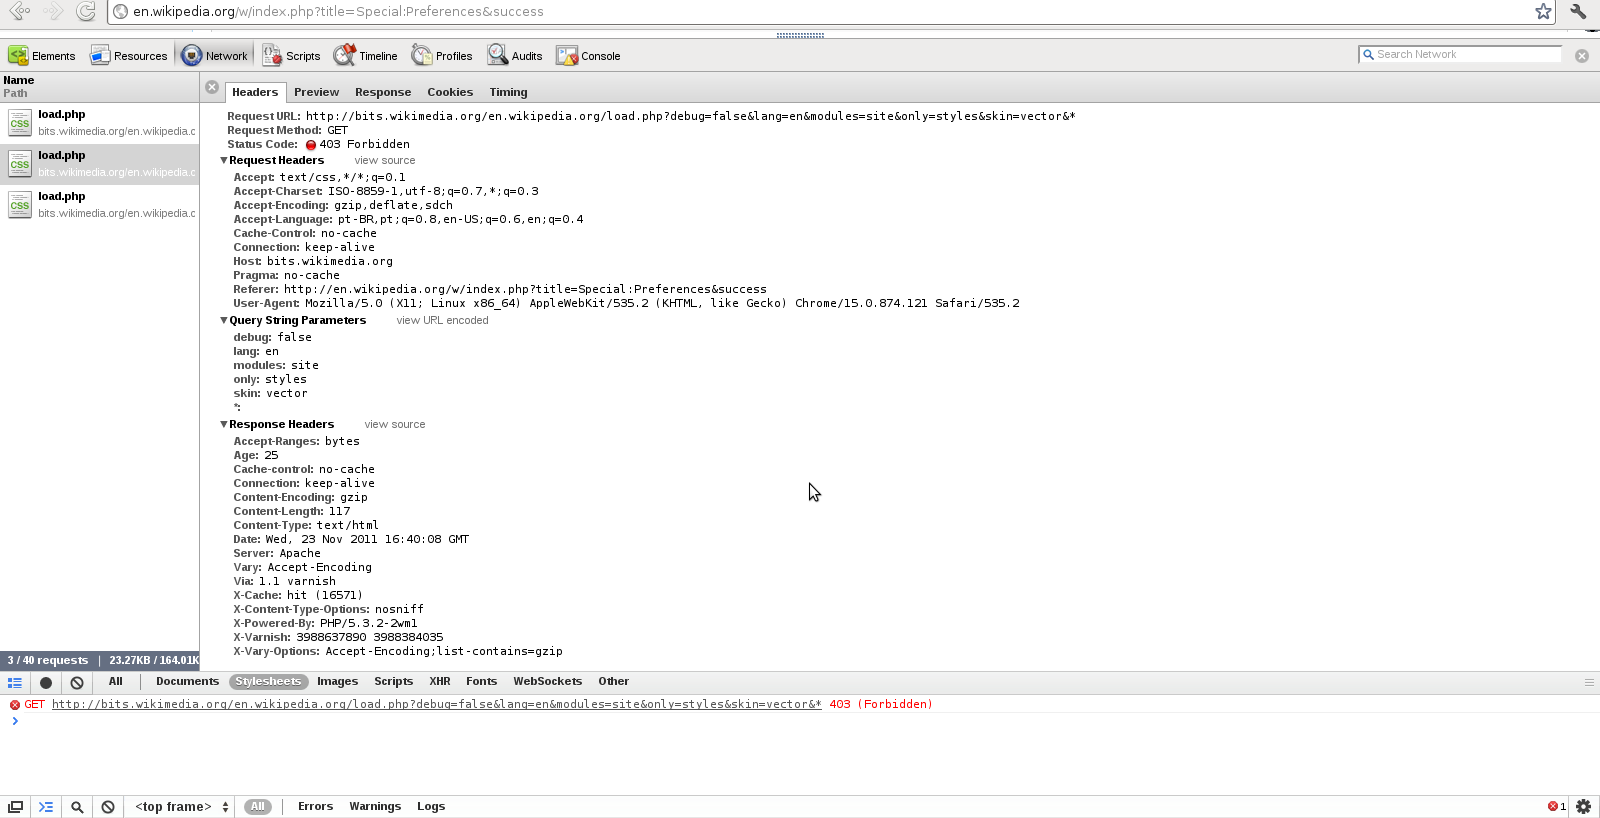
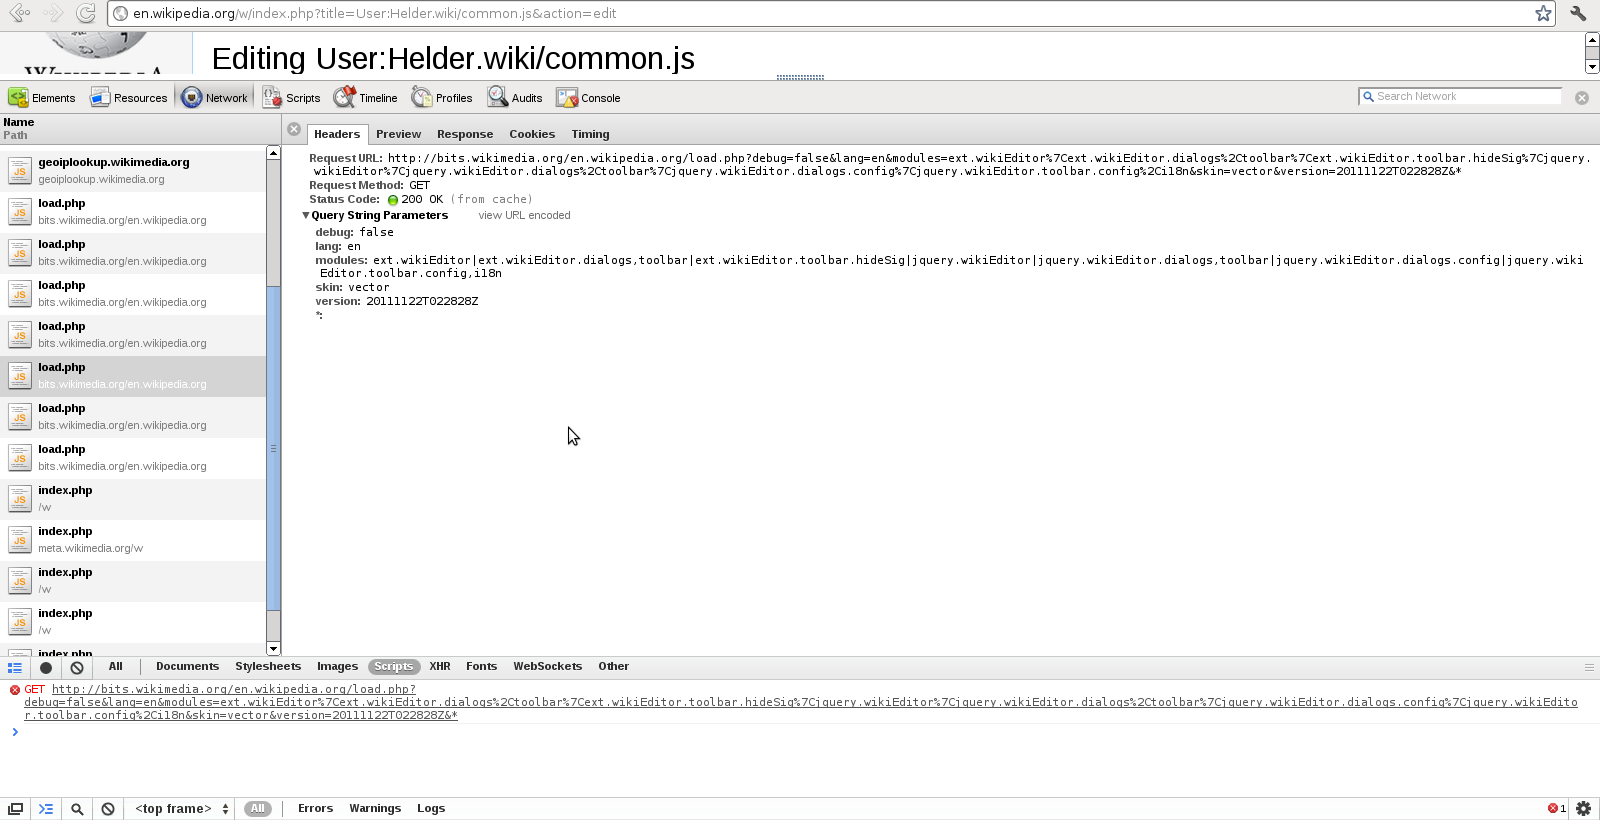
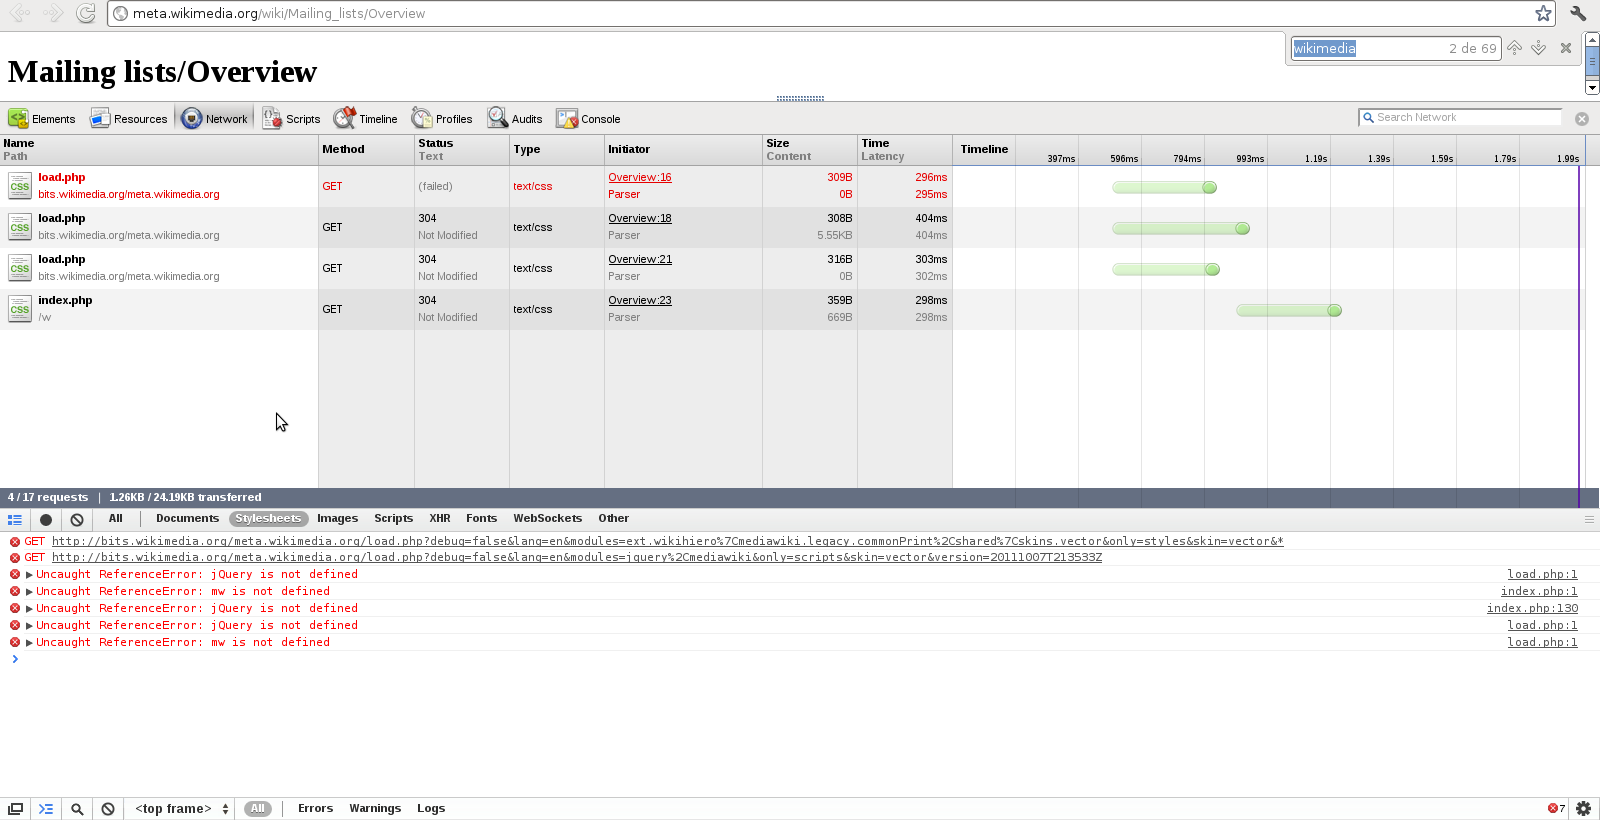
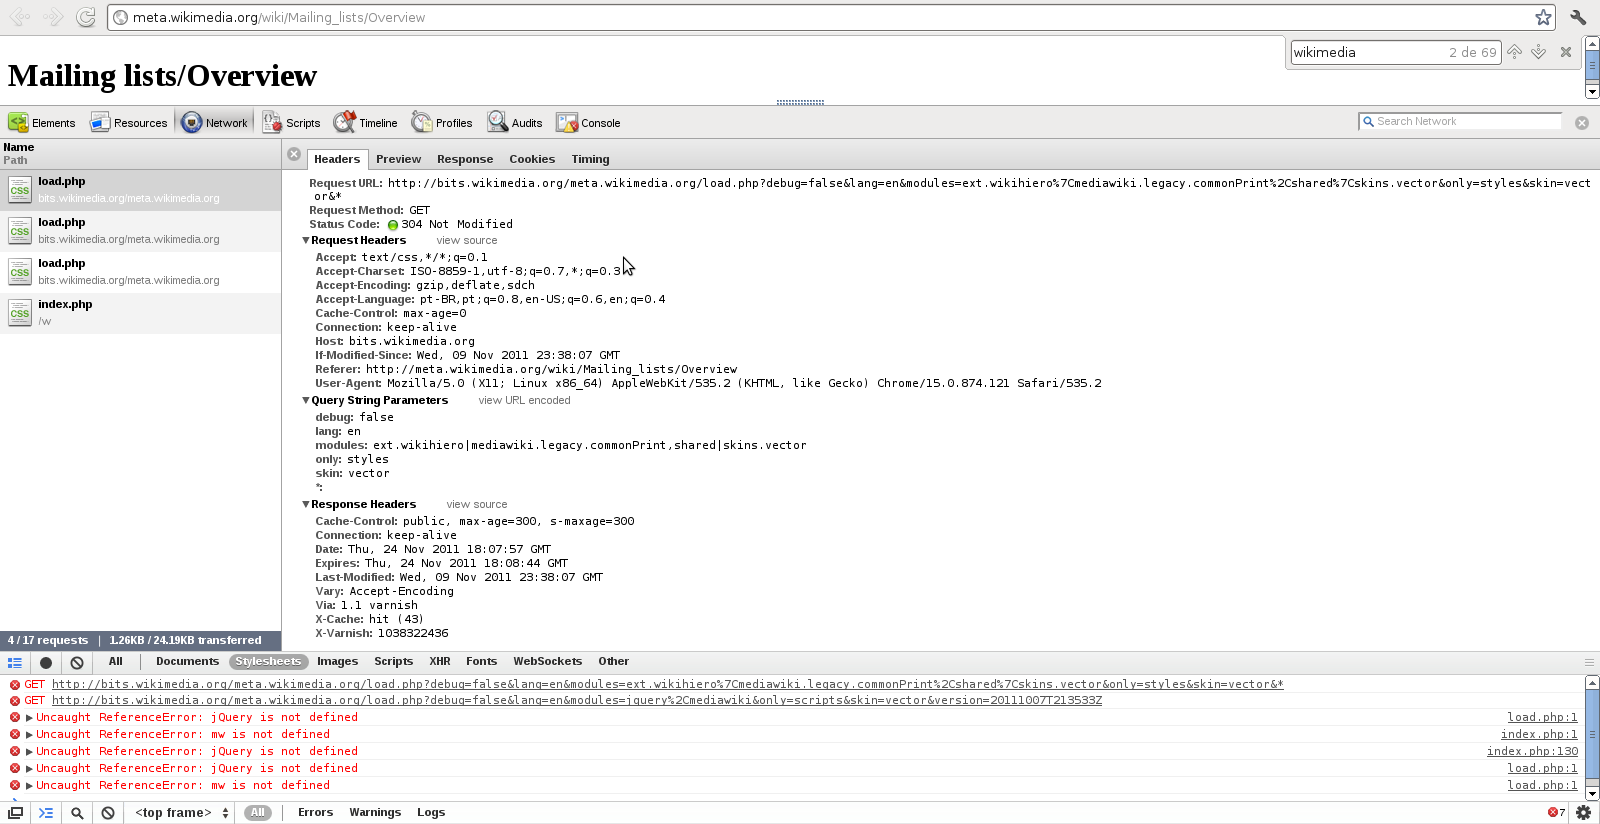
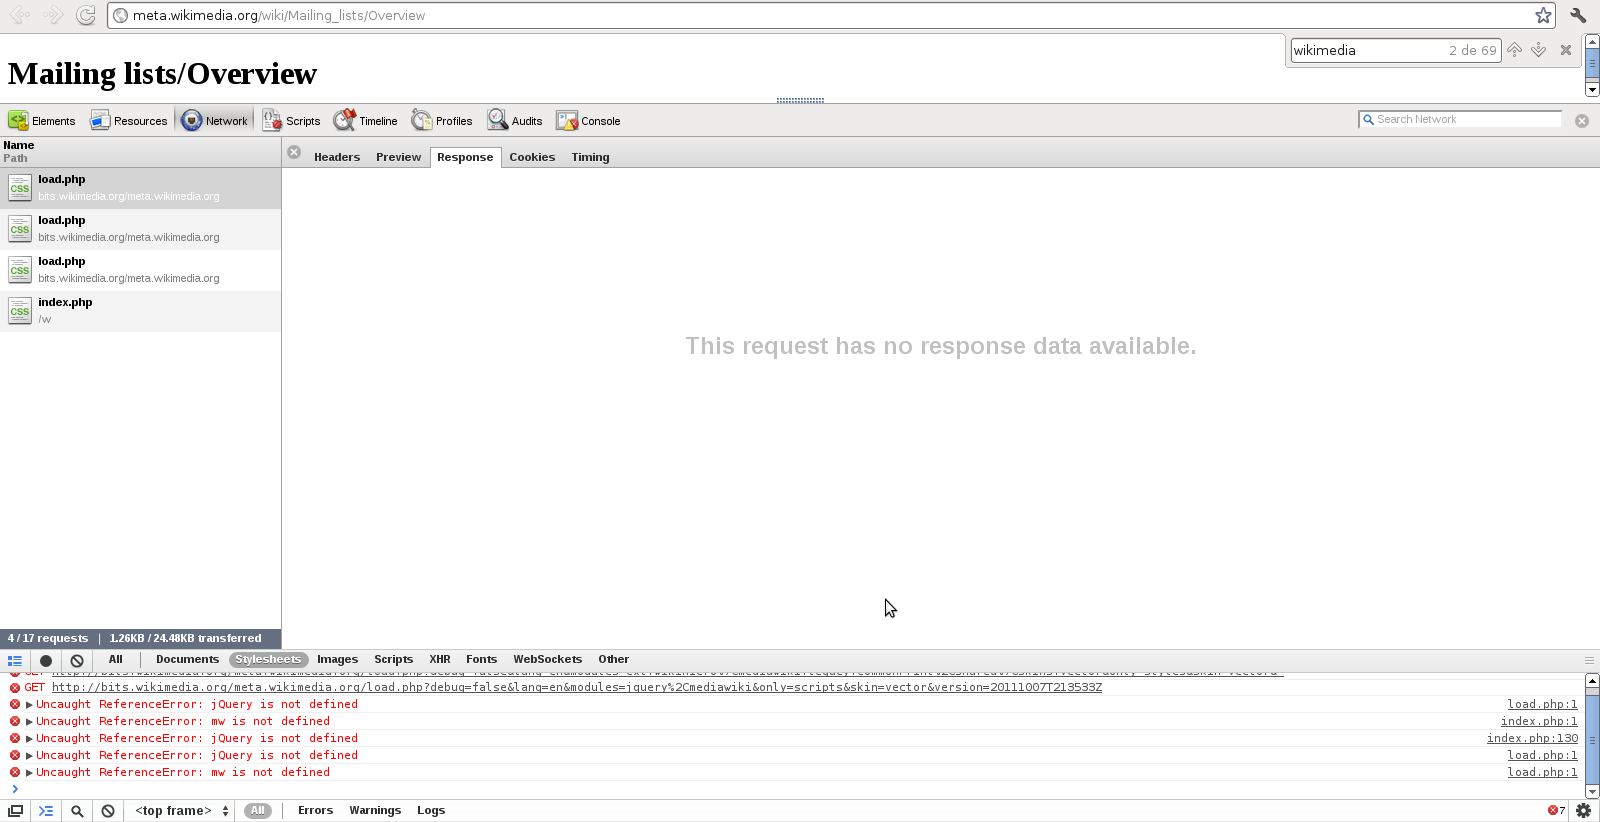
Occasionally the wiki pages are displayed without formatting. It seems that for some reason the CSS in not loaded.

Usually it is enough to refresh the cache by means of SHIFT+reload, but this has become necessary too often, so there seems to be something wrong. Besides, sometimes even if I refresh the current page, the problem happens again after I go to another page, making it necessary to clear the cache almost every page load.

At the moment I'm using Mozilla/5.0 (X11; U; Linux i686; en-US; rv:1.9.1.16) Gecko/20110430 Iceweasel/3.5.16 (like Firefox/3.5.16), and I am logged in on secure server.


Version: unspecified
Severity: normal

Details

Reference
bz29153

Event Timeline

bzimport raised the priority of this task from to Medium.Nov 21 2014, 11:30 PM
bzimport set Reference to bz29153.

Created attachment 8586
Screenshot

I've just clicked on
https://secure.wikimedia.org/wikipedia/en/wiki/Special:Random

and got redirected to
https://secure.wikimedia.org/wikipedia/en/wiki/Badia_%28Castiglione_del_Lago%29
and there was no formatting.

The problem was fixed after I pressed CTRL+SHIFT+R. I tried
https://secure.wikimedia.org/wikipedia/en/wiki/Special:Random

again and got
https://secure.wikimedia.org/wikipedia/en/wiki/Manny_Acta

without the formatting and needed to prees CTRL+SHIFT+R again.

Attached:

Screenshot-Badia_(Castiglione_del_Lago)_-_Wikipedia,_the_free_encyclopedia_-_Iceweasel.png (636×1 px, 104 KB)

Created attachment 8587
The second random example.

Attached:

Screenshot-Manny_Acta_-_Wikipedia,_the_free_encyclopedia_-_Iceweasel.png (678×1 px, 190 KB)

I've tried the Epiphany browser, version 2.30.6, but wasn't able to reproduce the bug (or wasn't persistent enough ;-)

But on Iceweasel the problem happened also in the insecure server:
http://en.wikipedia.org/wiki/Special:Random
redirected to
http://en.wikipedia.org/wiki/Antelothanasis
and the formatting was missing.

Possibly related or dupe of bug 28857 (or potentially a totally separate issue).

(In reply to comment #4)

Possibly related or dupe of bug 28857 (or potentially a totally separate
issue).

Hmm... Or maybe this is the same as bug 28714?

Honestly, all three could be the same issue, its hard to know if it is until the underlying cause is figured out.

It would be helpful if you could:

  • install Firebug
  • make sure Firebug is always enabled for secure.wikimedia.org (generally it's enough to open Firebug on a secure.wm.o page, then minimize it, it should remember your choice)
  • enable the Net panel (again, Firebug should remember this choice)
  • when this bug happens again, take a screenshot of the Net panel (of both the "All" and "CSS" tabs)

Roan, thanks for your debugging tips! I've been running into this,
too. Now, all I have to remember is the screenshot bit.

Created attachment 8608
Screenshot of the "ALL" tab

(In reply to comment #7)

  • when this bug happens again, take a screenshot of the Net panel (of both the

"All" and "CSS" tabs)

Here you are!

Attached:

Screenshot_-_All_-_European_Hockey_League_1999_-_Iceweasel.png (900×1 px, 135 KB)

Created attachment 8609
Screenshot of Firebug's "CSS" tab

Attached:

Screenshot_-_CSS_-_European_Hockey_League_1999_-_Iceweasel.png (900×1 px, 119 KB)

(In reply to comment #10)

Created attachment 8609 [details]
Screenshot of the "ALL" tab

Copy paste fail... I meant 'Screenshot of the "CSS" tab'.

Attached:

Screenshot_-_CSS_-_European_Hockey_League_1999_-_Iceweasel.png (900×1 px, 119 KB)

Created attachment 8610
Firebug - ALL

A second example, from article [[5 Canum Venaticorum]]

Attached:

Screenshot-ALL (900×1 px, 124 KB)

Created attachment 8611
Firebug - CSS

Attached:

Screenshot-CSS.png (900×1 px, 136 KB)

For the record: although the example above were from en.wp, I've also noticed it on other projects as well (e.g. pt.wp)

The screenshots of the CSS tab have the first entry expanded. Was there only one entry or were there more?

Also, the second page has half-completed styling, which is very weird. Are there any errors in the console tab?

(In reply to comment #15)

The screenshots of the CSS tab have the first entry expanded. Was there only
one entry or were there more?

There was only one, so I expanded that entry to give more detailed info.

Also, the second page has half-completed styling, which is very weird. Are
there any errors in the console tab?

Not that I remember. But I'll know for sure when it happens again =)

(In reply to comment #14)

For the record: although the example above were from en.wp, I've also noticed
it on other projects as well (e.g. pt.wp)

Are you able to reproduce this problem fairly reliably? If so, how reliably? Within 5 minutes?

If you are able to reproduce this, would you be willing to do a screen-sharing session with a developer so that we can get this tracked down?

(In reply to comment #17)

(In reply to comment #14)

For the record: although the example above were from en.wp, I've also noticed
it on other projects as well (e.g. pt.wp)

Are you able to reproduce this problem fairly reliably? If so, how reliably?
Within 5 minutes?

Since Roan suggested the use of Firebug, it only happened again yesterday. But in that occasion I was able to reproduce it at least once every 10 minutes (and some times on two or three consecutive page loads).

If you are able to reproduce this, would you be willing to do a screen-sharing
session with a developer so that we can get this tracked down?

Could I poke someone on IRC (who?) about this when I have access to the lab where I usually noticing the problem?

(In reply to comment #16)

(In reply to comment #15)

Also, the second page has half-completed styling, which is very weird. Are
there any errors in the console tab?

Not that I remember. But I'll know for sure when it happens again =)

Indeed. There was no errors in the console.

Right now, after I went to [[Special:PrefixIndex/Foo]] on the secure server, I was able to repeat the following at least 3 times in a row, being logged into my account:

  • Typing some other name instead of "Foo" in the box entitled "Display pages with prefix:" and pressing ENTER
  • The page was loaded without formatting (as in the previous screenshots)
  • Pressing CTRL+SHIFT+R or SHIFT+Reload
  • The page was loaded correctly, with all the usual formatting

To be sure it wasn't because of some JS, CSS or Gadget enabled in my user account, I logged out and was the steps above were still reproducible for 10 times or more.

While I was doing that, I noticed that in Firebug, in the cookie data displayed after expanding the list items (as in http://bug-attachment.wikimedia.org/attachment.cgi?id=8611) the value of "Cookie" included "enwikiUserName" even after I had logged out. I wasn't sure that it was supposed to be there for unlogged users, so I selected "Clear Recent History" in the browser, trying to clear everything. After this, I wasn't able to reproduce the bug anymore.

The browser used during these tests was the same as in the comment 1 (except that on this computer it is set to "pt-BR" instead of "en-US").

Hmm... what's up with the Cache-Control line?

In the screenshots (both bad & good) we see:

Cache-Control: public, max-age=2592000, s-maxage=2592000

on my own requests I see a much shorter user-facing timeout:

Cache-Control: public, max-age=300, s-maxage=300

If there's some funky cache thing going on it might be keeping bad data around much longer than expected?

(In reply to comment #20)

Hmm... what's up with the Cache-Control line?

In the screenshots (both bad & good) we see:

Cache-Control: public, max-age=2592000, s-maxage=2592000

on my own requests I see a much shorter user-facing timeout:

Cache-Control: public, max-age=300, s-maxage=300

If there's some funky cache thing going on it might be keeping bad data around
much longer than expected?

Are you sure you're comparing apples with apples? load.php requests that set the &version= parameter have the long timeout, and requests without a version have the short timeout. The latter is used for the startup module that contains the last-modified timestamps for all the other modules.

  • Bug 29214 has been marked as a duplicate of this bug. ***

During the RL2.0 sprint we'll look a this, no promises but a reminder.

Blocking bug 29272.

mybugs.mail@gmail.com has provided a screenshot which shows a load.php url supplying only 478 bytes of information (see http://bug-attachment.wikimedia.org/attachment.cgi?id=8608). If you see that again, it would be helpful to know what those 478 bytes were. Probably a warning?

For purposes of others watching this bug, the RL2.0 sprint is during July 2011 -- IOW one month from now. Please continue to supply information here.

Created attachment 8686
Detailed screenshots

The problem happened today again and I've attached screenshots of the detailed info about each item displayed on Firebug.

Attached:

Created attachment 8687
Detailed screenshots (part2)

Attached:

(In reply to comment #27)

PS: The CSS tab was empty.

Unless I'm mistaken, I don't see any CSS files being requested. Which seems odd.

(In reply to comment #28)

(In reply to comment #27)

PS: The CSS tab was empty.

Unless I'm mistaken, I don't see any CSS files being requested. Which seems
odd.

Not necessarily. CSS files are usually cached heavily. On a normal page view (not a hard refresh), its not unusual to not need any of the css files.

Not necessarily. CSS files are usually cached heavily. On a normal page view
(not a hard refresh), its not unusual to not need any of the css
files.

Which makes sense if this is the first time this page was viewed. But
if it wasn't the first time, then those additional images shouldn't
have been fetched.

And, if it was already fetched, then the CSS tab should not have been
empty, right?

Or, if the prior fetch of CSS returned an empty document, then the
styling problem should remain until a force-refresh wass done, at
least, which matches the symptoms in Comment #0.

(Sorry for being a pedant, but I'm just trying to track down all
details of this onerous issue.)

Well the images vary between every page. The CSS can be cached from previous pages on the wiki, where all the images might be new because they're only on a single page, so this could be the first time those images are seen. Since this page was loaded after a hit to [[special:random]]. Its quite probable that this is the first time that page was viewed.

Or, if the prior fetch of CSS returned an empty document, then the
styling problem should remain until a force-refresh wass done, at
least, which matches the symptoms in Comment #0.

yep. So perhaps the css just did not get loaded(?).

Other weird things, is that the the wmf button at the bottom of the page did not appear to be in the browser cache (no if-modified-since header so not in browser cache. no pragma:no cache header so request wasn't from a hard refresh. Would be consistent with firebug's disable browser cache option, but then the css should not be cached either). If any css was cached, one would expect other long cached resources to also be cached. The one JS file that was loaded was one that should be cached for a longish time, but the other js files that are normally cached for a short period of time were not loaded.

So yes, I think you're right in that the css was not simply just cached (although the evidence for that is kind of iffy), looks more like it just wasn't loaded, but I have no idea how that could happen.

I think sometimes logging/sampling the web server requests can be helpful in analyzing problems like this. Is that an option here? Could requests to bits.wikimedia.org be sampled and then check how many of them are either a 0 byte response length or return an HTTP code other than 200?

It's still a bit unclear to me how widespread this problem is (or if it's even a problem). I occasionally get pages with no CSS or limited CSS, but it could be Chrome being annoying or my ISP or whatever else. From some in-browser testing during times when bits.wikimedia.org wasn't returning the appropriate CSS, it seems it instead returns either a blank page or an error code of some kind (I can't remember which). If the incidence of these could be measured, I think it might be helpful.

(In reply to comment #32)

Could requests to
bits.wikimedia.org be sampled and then check how many of them are either a 0
byte response length or return an HTTP code other than 200?

Asher did some testing for stuff like this yesterday (404s+5xx) but adding 0 length would be good. He said that what he had wasn't scalable yet. I'll ask him if he can look at this some more.

It's still a bit unclear to me how widespread this problem is (or if it's even
a problem). I occasionally get pages with no CSS or limited CSS, but it could
be Chrome being annoying or my ISP or whatever else.

Reports started showing up after we pushed ResourceLoader and it isn't a browser-specific problem since you're seeing it on Chrome and I see it on FireFox. I doubt it is an ISP issue since the reports really started showing up after RL. (Although, it is possible that they started showing up because now we think it is RL and we're just seeing a pile-on effect).

If the incidence of these could be measured, I
think it might be helpful.

Thank you for this suggestion. I'll see if I can make it happen.

afeldman wrote:

The log analysis stuff I was working on was just for the squids so isn't applicable for secure bits requests. I'll look into what we currently collect and see if there's enough to analyze, or if we need to turn on additional logging.

afeldman wrote:

Is it safe to say that this bug is primarily just related to https wikipedia access via secure.wikimedia.org? I did see a comment about being able to reproduce the case via the http wikipedia.org but that seemed like an edge case related to a forked browser.

I've had pages return that look pretty much identical to the attached screenshot (http://bug-attachment.wikimedia.org/attachment.cgi?id=8608), but it's always been on http, never on https. I don't generally use https with Wikimedia wikis.

afeldman wrote:

Do we have any firebugs style resource load screenshots for this issue occurring via http?

afeldman wrote:

All of the example screenshots point to the secure gateway which is a single proxy server that doesn't handle some relative urls correctly. It's being replaced with a much better solution that will enable https:// on actual wiki domain names. Once that has been rolled out, it may solve this.

Any issue with css not loading from standard http wikis is likely a different issue but this ticket doesn't currently contain information that would help track it down. Screenshoots similar to what has been attached for the secure.wikimedia.org issue would be helpful.

btw, do we have any logging for times when a non-existant module is requested (how often does it happen, which modules)? [Today I accidentally screwed up something on my local install which caused all the modules to be missing, which caused very similar symptoms as to whats being described here. It's probably coincidence they have similar symptoms, but it'd perhaps be a good idea to have information on if there are requests for missing modules]

For the relative urls are screwed up on secure - If that was causing problems wouldn't we be seeing 404's in the firebug screenshots (or at least screwed up request urls)?

Created attachment 8736
Screenshot of MW Code Review without CSS on non-secure server

The bug just happened on MW.org when I was using Google Chrome, not logged, and using http.

Unfortunately I wasn't expecting it so when I pressed CTRL+SHIFT+J and went to the resources tab it displayed

"No requests captured. Reload the page to see detailed information on the network activity."

(and when I reloaded the page it was displayed correctly)

Anyway, when the error occurred this time, the error console displayed

"Failed to load resource".

Attached:

Screenshot_of_MW_Code_Review_without_CSS_on_non-secure_server.png (768×1 px, 132 KB)

I was visiting http://www.mediawiki.org/wiki/Thread:Talk:Article_feedback/%D0%A4%D0%B8%D0%BB%D1%8C%D0%BC%D1%8B_%D0%BE%D0%BD%D0%BB%D0%B0%D0%B9%D0%BD?useskin=vector just now and it loaded without styles. I investigated a bit and it was a getting a 404 from this URL: http://bits.wikimedia.org/www.mediawiki.org/load.php?debug=false&lang=en&modules=site&only=styles&skin=vector.

It was a standard "Not Found" 404 error message. I tried a few more times via the browser and curl and then it fixed itself, returning the appropriate CSS.

I don't think this is a issue related to the secure server. What's the status of logging frequency of HTTP codes other than 200?

afeldman wrote:

We now have a build of varnish 3.0 with a udp logging daemon that should be transparently compatible with our squid log collection infrastructure. There are some VCL language changes in 3.0 and the bits/geo-ip vcl needs porting and testing before bits will be upgraded. Mobile is getting varnish 3.0 first in the next week or two, then bits testing can begin.

I performed a days worth of local sampling internally on one of the bits varnish servers last week however and found rare 503's caused by first byte timeouts from the backend apache's (1:1000000 requests or less.) I filtered out 404's however due to the huge amount of legitimate ones being served due to malformed requests, bots, and broken bits installed on some wikis. I did just catch an interesting 404 on sq67 however, that was requested by Firefox 3.6.18

The RxURL listed is : http://bits.wikimedia.org/en.wikipedia.org/load.php?debug=false&lang=en&modules=mediawiki%21legacy%21commonPrint%7Cmediawiki%21legacy%21shared%7Cskins%21vector&only=styles&skin=vector

That's a good URL except, the RxURL field doesn't contain the protocol or host portion of the url - this means it was a request for : http://bits.wikimedia.org/http://bits.wikimedia.org/en.wikipedia.org/load.php?debug=false&lang=en&modules=mediawiki%21legacy%21commonPrint%7Cmediawiki%21legacy%21shared%7Cskins%21vector&only=styles&skin=vector

Not something I'd expect a 3.6 build of firefox to do - this could be an occasional bug in page rendering but it could also be due to factors outside of our control. I'm going to dig around further to see if I can find a load.php 404's that's been properly requested.

3724 SessionOpen c 209.226.31.161 50441 :80
3724 ReqStart c 209.226.31.161 50441 3365871486
3724 RxRequest c GET
3724 RxURL c http://bits.wikimedia.org/en.wikipedia.org/load.php?debug=false&lang=en&modules=mediawiki%21legacy%21commonPrint%7Cmediawiki%21legacy%21shared%7Cskins%21vector&only=styles&skin=vector
3724 RxProtocol c HTTP/1.1
3724 RxHeader c Host: bits.wikimedia.org
3724 RxHeader c User-Agent: Mozilla/5.0 (Windows; U; Windows NT 5.1; en-US; rv:1.9.2.18) Gecko/20110614 Firefox/3.6.18
3724 RxHeader c Accept: text/css,*/*;q=0.1
3724 RxHeader c Accept-Language: en-us,en;q=0.5
3724 RxHeader c Accept-Encoding: gzip,deflate
3724 RxHeader c Accept-Charset: ISO-8859-1,utf-8;q=0.7,*;q=0.7
3724 RxHeader c Keep-Alive: 115
3724 RxHeader c Proxy-Connection: keep-alive
3724 RxHeader c Referer: http://en.wikipedia.org/wiki/James_I_of_England
3724 VCL_call c recv lookup
3724 VCL_call c hash hash
3724 VCL_call c miss fetch
3724 Backend c 3775 appservers srv249
3724 TTL c 3365871486 RFC 120 1311214434 0 0 0 0
3724 VCL_call c fetch deliver
3724 ObjProtocol c HTTP/1.1
3724 ObjStatus c 404
3724 ObjResponse c Not Found
3724 ObjHeader c Date: Thu, 21 Jul 2011 02:13:54 GMT
3724 ObjHeader c Server: Apache
3724 ObjHeader c Content-Type: text/html; charset=iso-8859-1
3724 VCL_call c deliver deliver
3724 TxProtocol c HTTP/1.1
3724 TxStatus c 404
3724 TxResponse c Not Found
3724 TxHeader c Server: Apache
3724 TxHeader c Content-Type: text/html; charset=iso-8859-1
3724 TxHeader c Content-Length: 342
3724 TxHeader c Date: Thu, 21 Jul 2011 02:13:54 GMT
3724 TxHeader c X-Varnish: 3365871486
3724 TxHeader c Age: 0
3724 TxHeader c Via: 1.1 varnish
3724 TxHeader c Connection: keep-alive
3724 Length c 342
3724 ReqEnd c 3365871486 1311214434.264867306 1311214434.265794277 0.000029802 0.000903606 0.000023365

sumanah wrote:

Can the original bug reporter still reproduce this problem? Since we've now deployed SSL and MediaWiki 1.18 on all WMF wikis (so one doesn't need to use the secure.wikimedia.org server anymore), I'm curious to know whether it's recurring.

Created attachment 9532
Error console on Google Chrome

I noticed the problem several times today, when accessing pages such as
http://en.wikipedia.org/wiki/Bregman_divergence
on Google Chrome 15.0.874.121. Some times using CTRL+SHIFT+R or SHIFT+Reload didn't restore the formatting.

But the problem still doesn't happens consistently. I was logged in when It happened in the page above. I tryied to replicate it without success:

  • Being logged off
  • Using Iceweasel/3.5.16

Maybe it was something related to the fact that MediaWiki:Common.css was changed recently:
http://en.wikipedia.org/w/index.php?diff=462098416&oldid=461932865

Attached:

1_-_Screenshot-Bregman_divergence_-_Wikipedia,_the_free_encyclopedia_-_Google_Chrome.png (510×1 px, 71 KB)

Created attachment 9533
Network tab on Google Chrome

Attached:

2_-_Screenshot-My_watchlist_-_Wikipedia,_the_free_encyclopedia_-_Google_Chrome.png (654×1 px, 100 KB)

Created attachment 9534
Headers on Network tab on Google Chrome

Attached:

3_-_Screenshot-My_watchlist_-_Wikipedia,_the_free_encyclopedia_-_Google_Chrome_1.png (799×1 px, 129 KB)

Created attachment 9535
Headers on Network tab on Google Chrome, after disabling all gadgets and cleared user scripts

Attached:

shot-My_preferences_-_Wikipedia,_the_free_encyclopedia_-_Google_Chrome_-_after_disabling_gadgets.png (818×1 px, 119 KB)

Created attachment 9536
On this, the CSS was loaded but there was an error in a JS request

Attached:

6_-_Screenshot-Editing_common.js_-_Wikipedia,_the_free_encyclopedia_-_Google_Chrome.png (820×1 px, 117 KB)

(In reply to comment #47)

Created attachment 9535 [details]
Headers on Network tab on Google Chrome, after disabling all gadgets and
cleared user scripts

This one is very interesting: supposedly Chrome got a 403 Forbidden response (!!). If you ever get a 403 again, please include the full headers *and the content*. I can see from the Content-Length header that the response is 117 bytes, but I don't see the actual body of the 403 response in your screenshots. This should be in the "Response" tab.

The other failures are really weird. Attachment 9532 shows a failure for both flaggedrevs CSS and the jquery&mediawiki JS request (obviously if that one fails, any other JS that does load explodes immediately). Attachment 9533 shows a different page load where only the flaggedrevs CSS failed to load; according to the net panel it failed to load, but when you look at the details in attachment 9534 the response from the server was a 304 (which means Chrome must've had a cached version handy, and the server is telling it that that cached version is still good; so how can it fail to load?). Attachment 9535 makes sense to me (403 from the server, don't know how that would happen, but Chrome's reaction to it makes sense), but attachment 9536 is even weirder: the WikiEditor request fails to load, but it's a cached 200 response?!

This might be related to http://stackoverflow.com/questions/6559825/corrupt-google-chrome-cache (doubtful, though, as I haven't seen any weird Range headers in your screenshot), or to another bug that might exist in Chrome where it sends a no-caching header (Cache-Control: max-age=0 in one of your screenshots, Cache-Control: no-cache & Pragma: no-cache in the other)
along with an If-Modified-Since header; I'm not sure if that's legal and how servers are supposed to respond to that, but we respond to it with a 304 (because of the IMS) and I guess that might confuse Chrome.

Attached:

shot-My_preferences_-_Wikipedia,_the_free_encyclopedia_-_Google_Chrome_-_after_disabling_gadgets.png (818×1 px, 119 KB)

I also see this randomly (missing of Common.css). Browsers used include Iceweasel on PC and Opera Mini on cellphone IIRC. I cannot reproduce it somehow so it's not easy for me to provide debug info.

Created attachment 9545
Metawiki - Google Chrome - Network and error console

The problem happened on Meta-wiki, while I was logged in. Here are the screenshots.

Attached:

Google_Chrome_-_Network_and_error_console.png (820×1 px, 107 KB)

Created attachment 9546
Metawiki - Google Chrome - Headers and console

Attached:

Google_Chrome_-_Headers_and_console.png (824×1 px, 140 KB)

Created attachment 9547
Metawiki - Google Chrome - No Response, No Preview and no Cookies

This screenshot shows that there was no response. I've checked also preview and cookies tabs and they were blank too.

Attached:

Google_Chrome_-_No_Response,_No_Preview_and_no_Cookies.png (822×1 px, 87 KB)

afeldman wrote:

I just deployed a change to our bits varnish servers that has the following effect:

  • if a backend request fails with a 5xx error, varnish will retry up to 4 times
  • if content has changed but the backend is taking too long to generate a new version, the expired content will still be served for up to 20 minutes

I'm hopeful that this will largely address the issue. Please continue to provide feedback on any future occurrences.

I met this again and caught related request&response data, it's a 403 Forbidden:

Location

http://bits.wikimedia.org/zh.wikipedia.org/load.php?debug=false&lang=zh-cn&modules=ext.wikihiero%7Cmediawiki.legacy.commonPrint%2Cshared%7Cskins.vector&only=styles&skin=vector&*

Request Headers

Host: bits.wikimedia.org

User-Agent: Mozilla/5.0 (X11; Linux x86_64; rv:7.0.1) Gecko/20100101 Firefox/7.0.1 Iceweasel/7.0.1

Accept: text/css,*/*;q=0.1

Accept-Language: en-us,en;q=0.5

Accept-Encoding: gzip, deflate

Accept-Charset: UTF-8,*

Referer: http://zh.wikipedia.org/wiki/Template:Subst_after/doc

DNT: 1

Connection: keep-alive

Response Headers

Server: Apache

X-Powered-By: PHP/5.3.2-2wm1

X-Content-Type-Options: nosniff

Cache-Control: no-cache

Content-Encoding: gzip

Vary: Accept-Encoding

X-Vary-Options: Accept-Encoding;list-contains=gzip

Content-Type: text/html

Content-Length: 117

Accept-Ranges: bytes

Date: Thu, 01 Dec 2011 16:01:42 GMT

X-Varnish: 1642196564 1641737561

Age: 45

Via: 1.1 varnish

X-Cache: hit (37)

Response Body

Scripts should use an informative User-Agent string with contact information, or they may be IP-blocked without notice.

afeldman wrote:

This is a different case than at least some of the previous ones (based on content-length + non-empty response body) but this is a great find.

In this case, a request for the given url is hitting bits without a user-agent, mediawiki returns a 403 for that reason, and varnish is caching the 403. I should be able to fix this case today.

afeldman wrote:

The fix for not caching 403's has been pushed to production (though if any of these are currently cached, they'll have to expire.)

(In reply to comment #56)

This is a different case than at least some of the previous ones (based on
content-length + non-empty response body) but this is a great find.

In this case, a request for the given url is hitting bits without a user-agent,
mediawiki returns a 403 for that reason, and varnish is caching the 403. I
should be able to fix this case today.

I always thought that user-agent 403's were given by the squids/varnish servers themselves not MediaWiki (Although I suppose it could still be caching its own response).

afeldman wrote:

The no-ua 403 does come from mediawiki, but it's a wmf specific customization:

wmf-config/checkers.php: die( "Scripts should use an informative User-Agent string with contact information, or they may be IP-blocked without notice.\n" );

I saw this again but didn't log any debug info this time. However I guess all cache must have gone away.(In reply to comment #57)

The fix for not caching 403's has been pushed to production (though if any of
these are currently cached, they'll have to expire.)

I saw this again but didn't log any debug info this time. However I guess all cache must have gone away.

I think I found something which may be related to (or be) the cause of these errors in the computers I use. Everything seems to work fine until I get near my disk quota on these linux machines. After that, the frequency of the errors increase a lot.
Once I clear my browser's navigation data, or delete some files, it seems to stop failing and works until I reach my quota again.

(In reply to comment #61)

I think I found something which may be related to (or be) the cause of these
errors in the computers I use. Everything seems to work fine until I get near
my disk quota on these linux machines. After that, the frequency of the errors
increase a lot.
Once I clear my browser's navigation data, or delete some files, it seems to
stop failing and works until I reach my quota again.

Hmm interesting. Possible explanations I could see for this is:
*Firefox is very broken when its low on disk space
*Firefox stops caching things when low on disk space, resulting in getting things directly from the server more often, and hence errors happening more regularly (This assumes instances of css failing are the result of requests that fail in a way that isn't cached on the client side)

I don't see such errors these days.

(In reply to comment #62)

Hmm interesting. Possible explanations I could see for this is:
*Firefox ...

For the record: when I tested what I said in comment 61 I was using Google Chrome.

Helder: Is this still a problem nowadays?

If I try to use one of those computer where there is the disk quota, the errors increase in frequency as Google Chrome use more and more space...

(and this happens quite often, as a simple search confirms:
https://www.google.com.br/search?q=%22google+chrome%22+folder+too+big
)

User quota is nothing that could be fixed by MediaWiki...