Page MenuHomePhabricator

Some Wikidata pages takes too much time to load (~4min) and uses too much CPU while loading
Closed, ResolvedPublic

Description

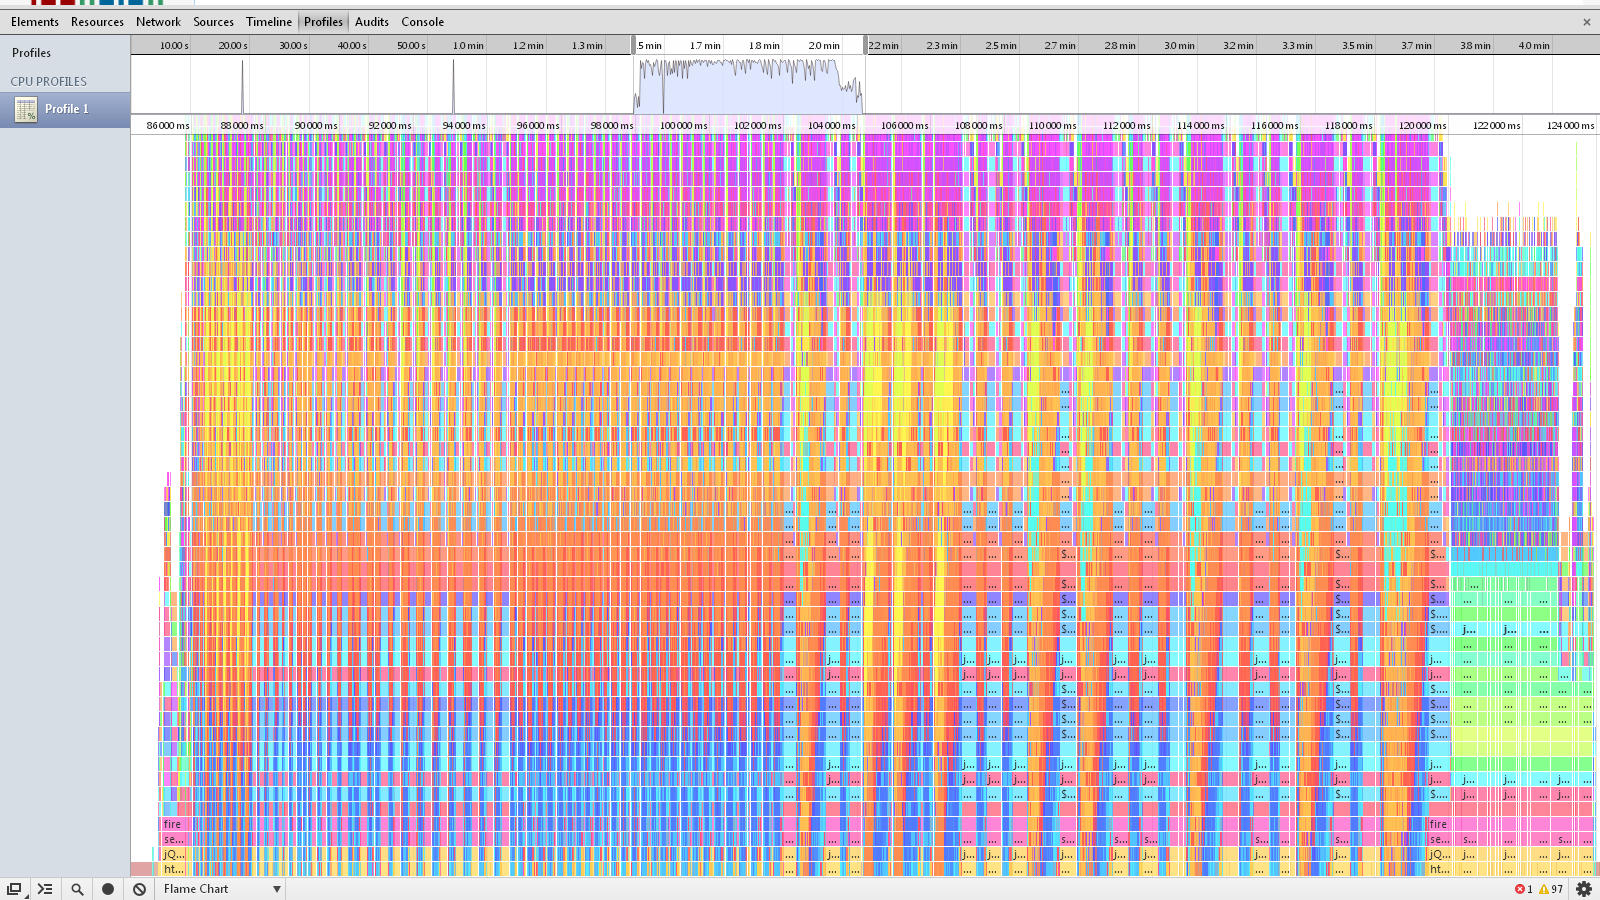
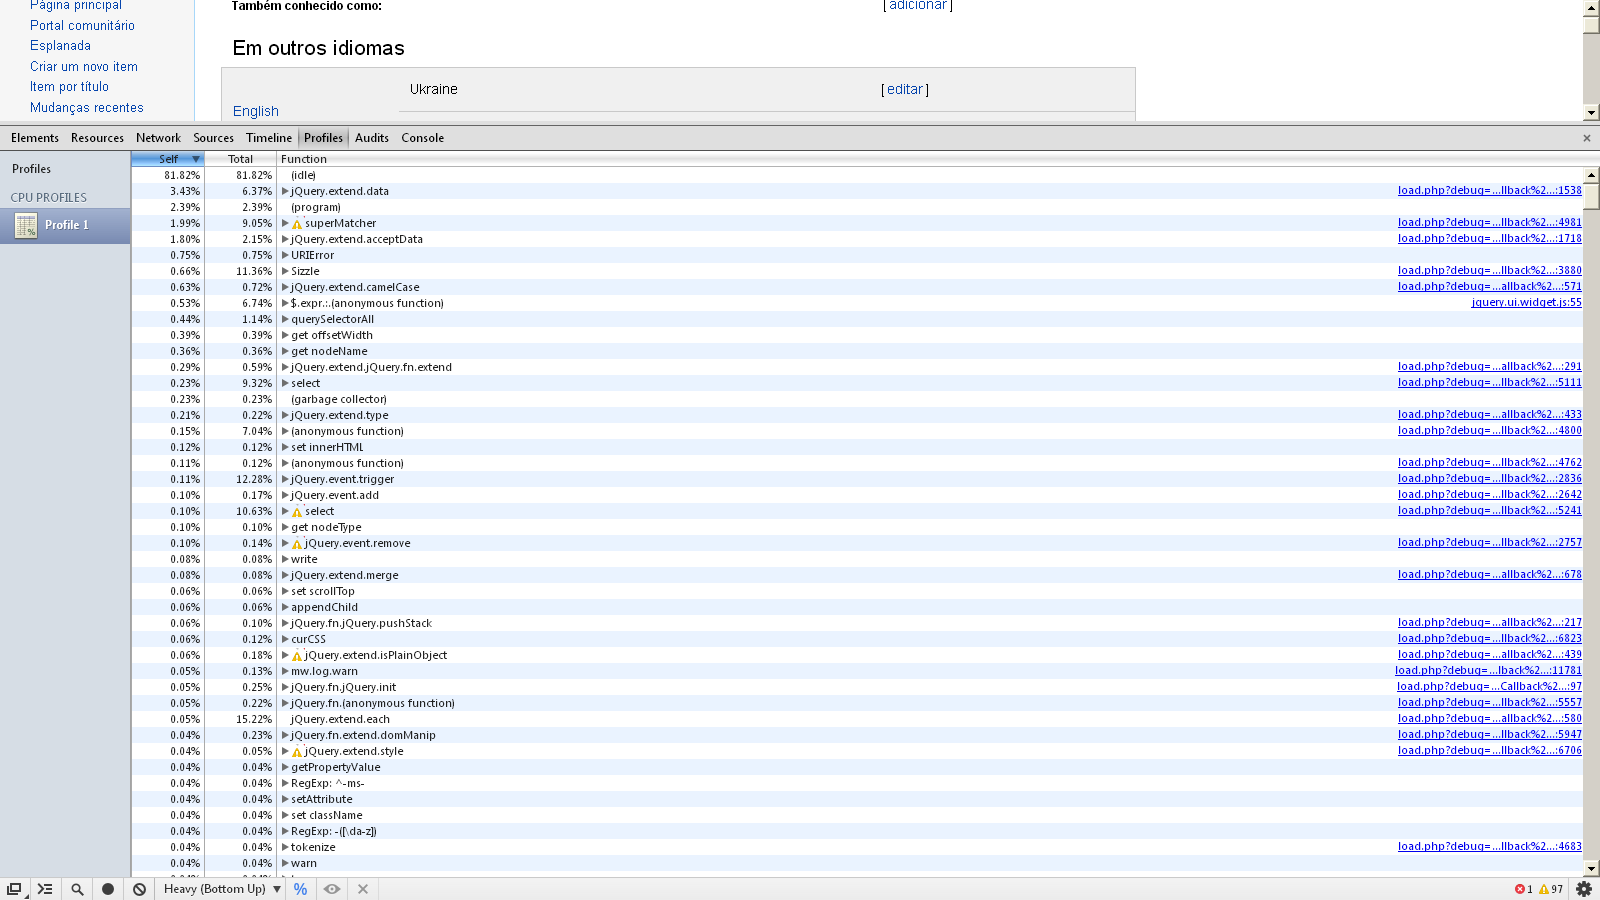
CPU-20131206T162413.cpuprofile

Inspired by the report at
https://www.wikidata.org/wiki/Wikidata:Project_chat#Firefox_freezes_opening_an_item_in_a_new_tab
I used Google Chrome to generate a CPU profile on this page:
https://www.wikidata.org/wiki/Q212?debug=1

The browser cache was emptied before testing and the page took ~4 minutes to finish loading.

I saved the profile and uploaded as an attachment (you can inspect it after loading it into Google Chrome).


Version: master
Severity: normal

Attached:

Details

Reference
bz58106

Event Timeline

bzimport raised the priority of this task from to Needs Triage.Nov 22 2014, 2:26 AM
bzimport set Reference to bz58106.
bzimport added a subscriber: Unknown Object (MLST).

Created attachment 14005
Flame Chart

Attached:

Flame_Chart_on_Wikidata.png (900×1 px, 196 KB)

Created attachment 14006
CPU time by function

Attached:

CPU_time_by_function.png (900×1 px, 113 KB)

This is caused by two problems, one of which is somewhat easy to fix when you know what to look for (see below), and the other not so much.

The second problem is, obviously, the fact that *there's just so much code*, and executing more code usually takes more time. I think even loading VE requires less. Seriously, this is mad.

The first is that elements are sometimes first inserted into DOM, and then "filled" with their children. This causes continuous reflows and repaints when executing the script. The 81.82% "idle" time in Helder's log is spent on reflows, repains and other related browser activities.

The worst offender here seems to be jquery.wikibase.entityview, which does
$( '<div/>' ).appendTo( this.element ).claimgrouplistview( { … } )
– where the .claimgrouplistview() call generates the entire list of claims that spans several screens of text. If you scroll down during the loading of the page, you can see the claims being built part-by-part in real time.

The obvious fix – changing the order of operations – seems to cause all of the edit links not to appear (unless I borked something else). I did not investigate the root cause, probably something somewhere ten levels of abstraction deep calls .parent()/.closest(), which at that point returns an empty collection due to the element being parentless. Somebody more knowledgeable about the code will probably be able to track this down easily.

  • This bug has been marked as a duplicate of bug 54098 ***