Page MenuHomePhabricator

Search is sometimes slow on the Beta Cluster
Closed, ResolvedPublic

Description

Rummana saw the issue described in bug 70103 again.

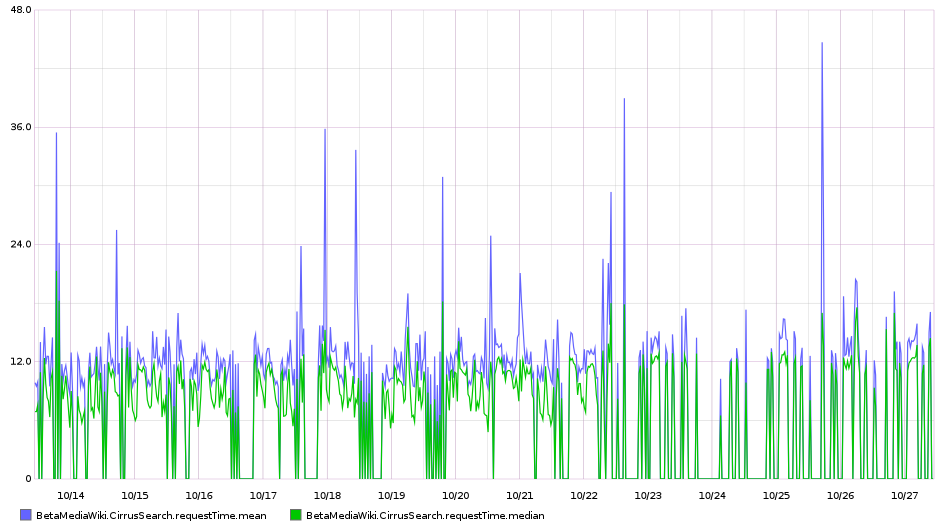
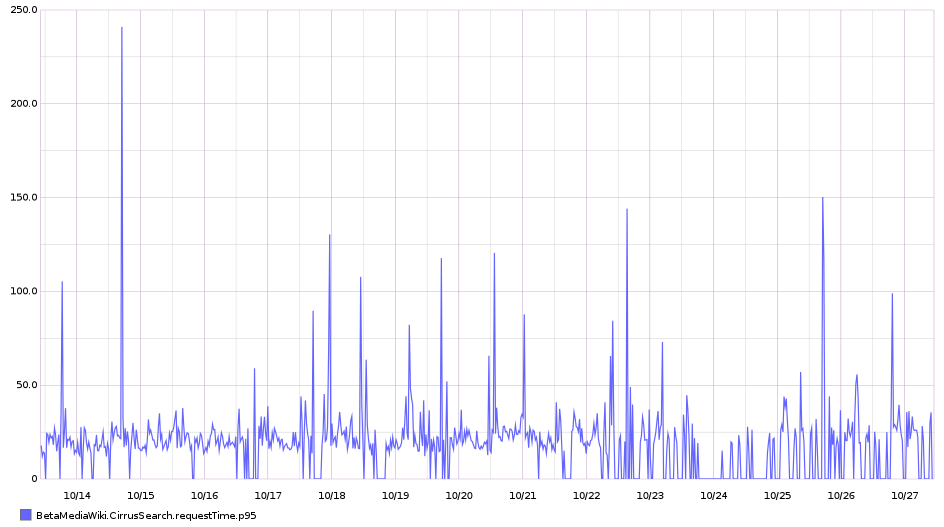
The search requests (either in the drop down on the top right, or within VE) are sometimes taking a lot longer than normal.

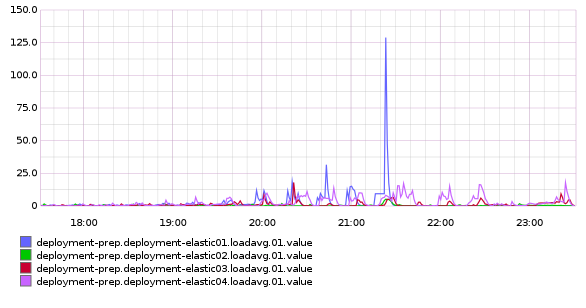
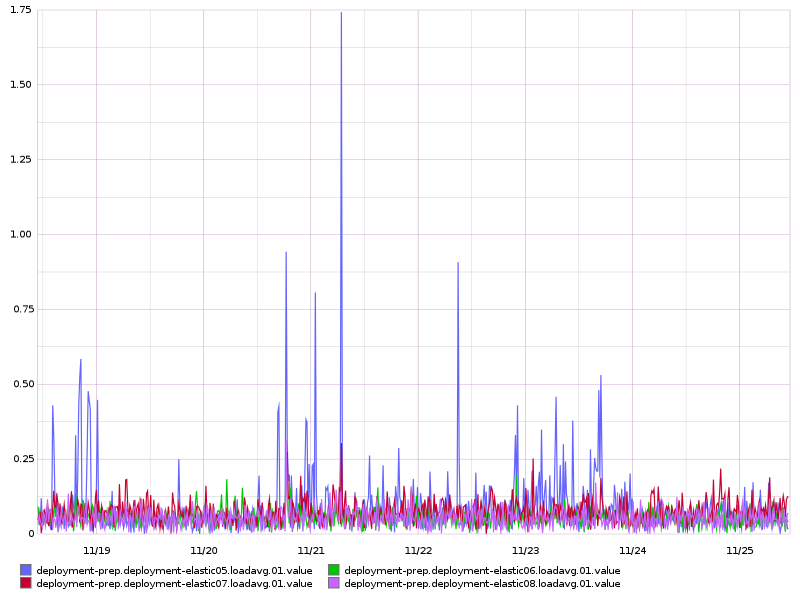
Looking at graphite I see a weird spike on one of the elastic search boxes: 1 minute load averages on deployment-elastic* instances over 7 days

render-6.png (600×800 px, 80 KB)


Version: unspecified
Severity: normal
See Also:
https://bugzilla.wikimedia.org/show_bug.cgi?id=70940

Details

Reference
bz70869

Event Timeline

bzimport raised the priority of this task from to Medium.Nov 22 2014, 3:45 AM
bzimport set Reference to bz70869.
bzimport added a subscriber: Unknown Object (MLST).

(setting normal for now, but if it starts causing browser test failures or otherwise, we'll bump it up)

Created attachment 16480
Elastic search instances load average

Attached:

render-5.png (308×586 px, 21 KB)

Chad / Nik are the best point to investigate ElasticSearch related issue. Maybe someone imported a bunch of articles on beta which caused a lot of indexing on ElasticSearch side.

I can have a look at it soon - yeah. The Elasticsearch cluster in beta isn't designed for performance - just to be there and functional.

Did a bit of digging this morning. Here is a graph of io load:
http://graphite.wmflabs.org/render/?width=586&height=308&_salt=1410964216.337&target=deployment-prep.deployment-elastic01.cpu.total.iowait.value&from=-96hours

The spike is our slow time. It looks like we saw a spike in the number of queries but I can't be sure. We keep query counts in ganglia but that doesn't seem to be working well today.

I'm willing to chalk it up to a spike in requests to beta and intentionally underpowered systems.

Note that ganglia on labs has been dead for a long time, and will remain so for the foreseeable future. Do send metrics to graphite instead for labs :)

(In reply to Nik Everett from comment #7)

I'm willing to chalk it up to a spike in requests to beta and intentionally
underpowered systems.

I just want to underline this. "Intentionally underpowered" is so that glitches like this will be noticed and investigated.

Sometimes, like here it seems, the investigation turns up nothing much, but the underpowered nature of beta labs often triggers real problems that would be much more drastic at production scale.

Thanks Rummana, thanks Nik...

In this case I'm kind of blind because of lack of ganglia - its really a shame that we don't have it working and/or no one has found the time to port the ganglia monitoring to graphite.

Maybe relevant: I see request spikes in production that don't translate into huge load spikes because we use the pool counter to prevent it. I don't believe beta has the pool counter configured at all.

(In reply to Nik Everett from comment #10)

Maybe relevant: I see request spikes in production that don't translate into
huge load spikes because we use the pool counter to prevent it. I don't
believe beta has the pool counter configured at all.

At all as in? (What are the next steps to put that in place? Please file bugs :) )

@greg @nik: We have ES metrics in graphite also now (graphite.wmflabs.org) so might make it easier to debug?

@greg @nik: We have ES metrics in graphite also now (graphite.wmflabs.org) so might make it easier to debug?

@Manybubbles: see above ^

(Also, you should add your "neverett+bugzilla" email to Phab so you can claim your old comments)

greg lowered the priority of this task from Medium to Low.Nov 24 2014, 11:53 PM
greg moved this task from To Triage to Backlog on the Beta-Cluster-Infrastructure board.

Ganglia has been phased out in favor of using diamond on the hosts which collect host metrics and emit them to a labs Graphite: https://graphite.wmflabs.org/ . The 1 minute load average for elastic instances is: [deployment-prep.deployment-elastic*.loadavg.01.value](http://graphite.wmflabs.org/render/?width=800&height=600&from=-7days&target=deployment-prep.deployment-elastic*.loadavg.01.value). I will update this task details to point to the URL.

Timo wrote a JavaScript frontend on top of it which list a few metrics for all instances of a given project: https://tools.wmflabs.org/nagf/?project=deployment-prep

hashar updated the task description. (Show Details)
Restricted Application added a subscriber: Aklapper. · View Herald Transcript
hashar claimed this task.

Using http://graphite.wmflabs.org/ we have a few metrics under BetaMediaWiki.CirrusSearch.requestTime.

For the last two weeks:

  • BetaMediaWiki.CirrusSearch.requestTime.mean
  • BetaMediaWiki.CirrusSearch.requestTime.median

render-3.png (527×944 px, 107 KB)

  • BetaMediaWiki.CirrusSearch.requestTime.p95

render-4.png (527×944 px, 54 KB)

Assuming it is in miliseconds.

The load average over 1 minute is rather flat as well.